This is a guest post by Chris Cox of CRC Earth Analytics. This post walks you through his process using the NMWDI SensorThings API to make a quick demonstration application that displays interactive water wells and associated data in map and graph form.

The mean annual precipitation in NM is about 14 inches which makes it one the driest states in the US. Almost the entire Western US is much drier than the Eastern US, and climate change is likely to make things worse. Water management is therefore critical, and I recently started interacting with the New Mexico Water Data Initiative (NMWDI). Created as part of NM House Bill 651 (2019), the NMWDI is managed by the NM Bureau of Geology and Mineral Resources with the mission of developing a hub for NM water data to facilitate data discovery and access.
The types of data accessible via NM Water Data range from climate, to groundwater, to water quality. Much of the data is provided by State and Federal agencies like the NM State Engineer and the USGS, but there are also partnerships with various non-profits. In some cases, the data is available for direct download or there is a link to the data provider’s website. Importantly, a subset of the data can be accessed programmatically via a “Sensor Things” API.
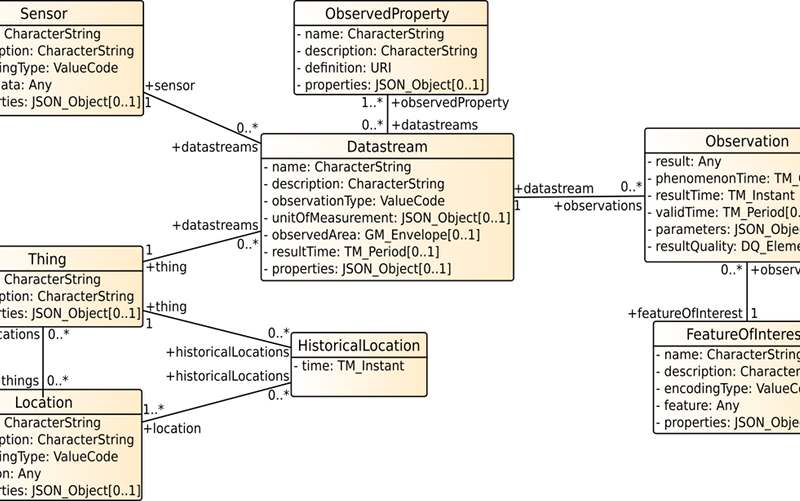
A SensorThings API follows a standardized approach to designing an API (described further below), and provides a powerful means for quickly accessing and manipulating data. However, I get the impression the SensorThings standard is not yet widely implemented, and it took some time for me to understand how it works. In this blog post I describe what the SensorThings API is, how it works, and how I utilized NMWDI’s SensorThings API to create an app (http://apps.crceanalytics.com/sensorthingsdemo) that displays NM groundwater data.

