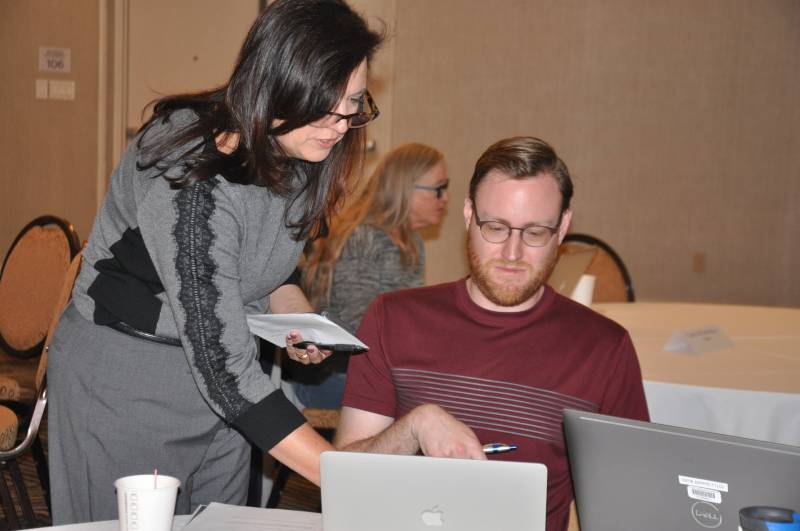
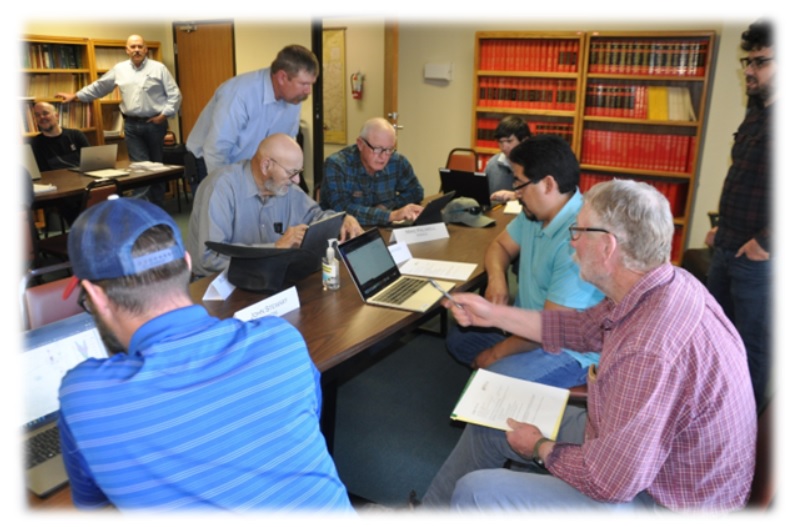
Figure 1 Getting familiar with the data dashboard, Albuquerque
Once data are available, it’s never too soon to ask for feedback on the usefulness and functionality of any data visualization or dashboard under development. Engaging stakeholders in the early stages of the process is valuable as their experiences and feedback can more readily be used to improve the end products while there is funding and time to make improvements.
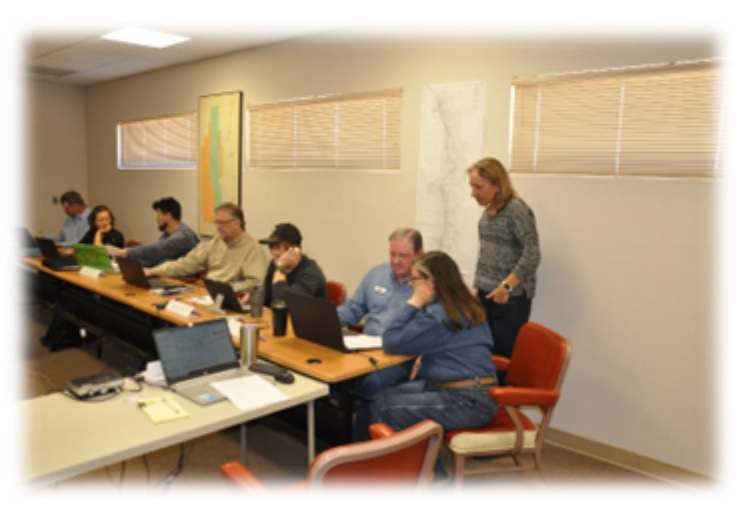
Four in-person workshops over two days in March 2022 were designed to evaluate the ease of use of a first dashboard, refine the tools, as well as identify missing data for a water data project in the Pecos Valley (Figure 2).
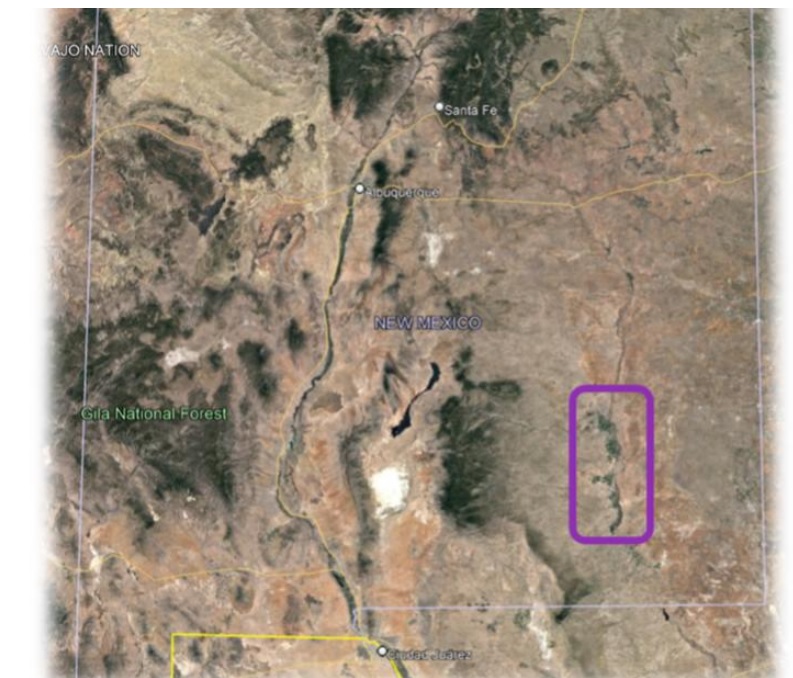
This project is a pilot project is funded by a U.S. Bureau of Reclamation WaterSMART cooperative grant with the New Mexico Bureau of Geology and Mineral Resources in collaboration the Pecos Valley Artesian Conservancy District. This project is in collaboration with Internet of Water and includes data access through a dashboard developed by Wellntel.
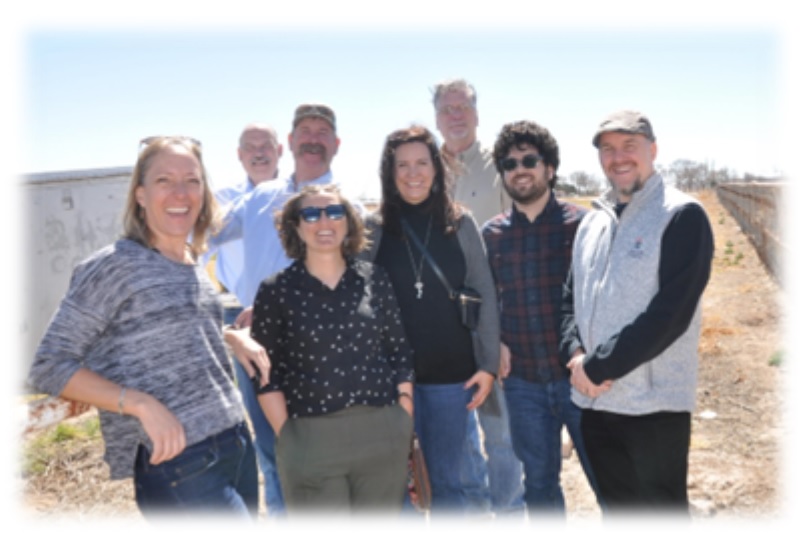
The Water Data Initiative project team hosted small group workshops on March 14 and 15, 2022 in Albuquerque and Roswell. One of the goals of these in person meetings, was to physically observe and discover how people interacted with the platform, including their expressions, comments to one another, and even under-the-breath mutters to themselves. Peoples’ uninhibited responses to the platform provide valuable insight to what is working well and what needs improvement at this stage of development.
Early engagement serves to inform the software developers of changes they could make now to meet the users’ end needs. The collaborative effort leads to solutions improvement as the approach allows for flexible responses. Using this practice saves time and resources, which may otherwise be wasted if the final product needs to be revised and corrected.
Purpose of Data Dashboard and Feedback
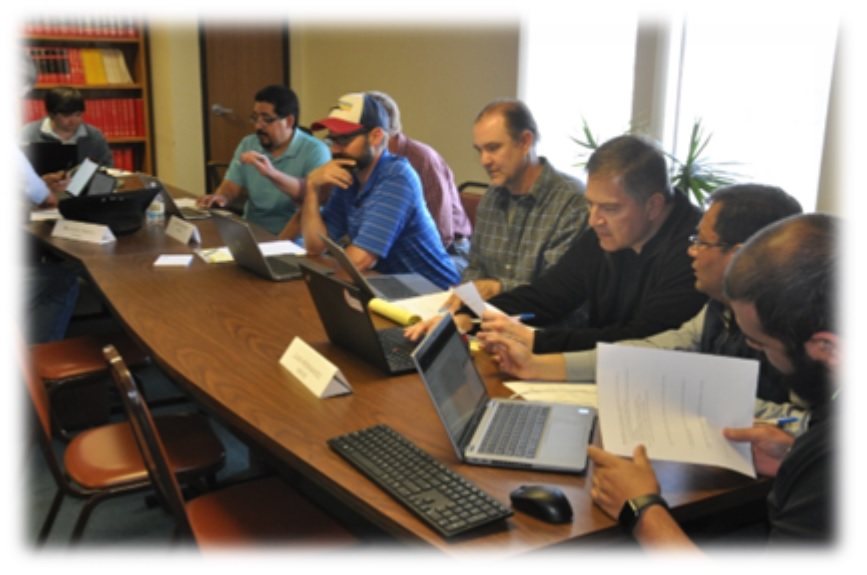
Purpose of Data Dashboard and Feedback Participants, from state and federal agencies, the Pecos Valley Artesian Conservancy District, and consultants to the conservancy district, experimented with the dashboard designed to explore historic groundwater level data, along with several other state and federal surface water and groundwater data features. All participants were asked to work independently through two exercises. They provided answers to questions in a workshop, describing what they liked and suggestions for improvements, and engaging in a group discussion to share their experience.
When the dashboard is opened, the user begins with a map, and the sidebar provides an option to select and load different datasets. The user has the option to choose the data type they are most interested in, such as the location of wells, flows, depth to groundwater, climate data, or other datasets, and populate the map with the available data. Users also have the option to build customizable charts and graphs to show trends in groundwater levels or compare datasets.
In general, many users said they liked the maps, charts and graphs provided in the dashboard. Specific suggestions for improvements included making the interface more intuitive by not requiring user to load data, which was time consuming, allowing users to download data, and building an address search bar.
Next Steps
The Water Data Initiative project team will review and incorporate the feedback from the workshops to improve the data dashboard and write a summary of the workshops. With this information, the team intends to revise and improve the dashboard, and will seek additional input as iterations of the platform are developed, with the end goal of completing the project in January 2024.
