In this data-heavy “Age of Information” in which we live, agencies like the Arizona Department of Water Resources constantly struggle with how to make information we collect more easily available to the public.
And, at the same time, we work to assure the accuracy of our datasets and to present them in a meaningful and useful way.
The Department collects tons of data. Data about water stored behind dams. And on water flowing between dams, like Glen Canyon and Hoover dams on the Colorado River.
We collect information about wells. About how water is used by cities, farms, golf courses and myriad other uses.
We collect reams of data on the amounts of water stored in aquifers underground – water that is both naturally and artificially recharged into those aquifers.
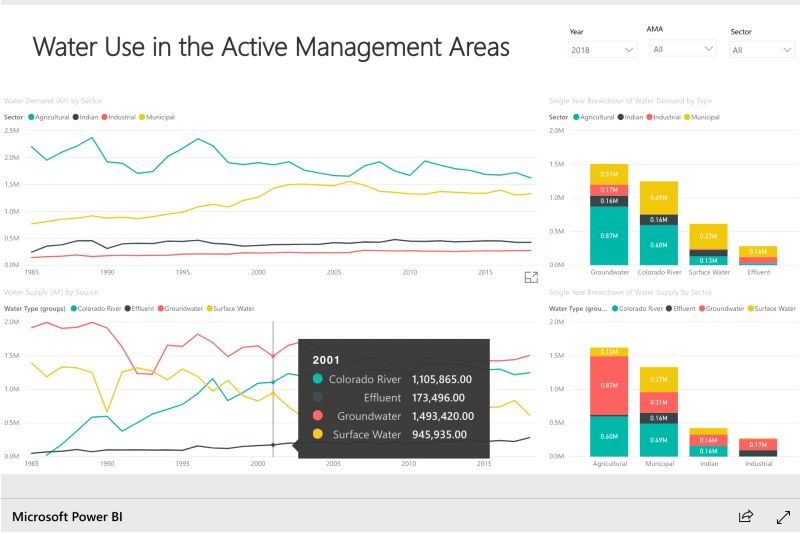
How does the Department make that data useful to the public? One increasingly useful tool is known as “Power BI,” a business analytics service produced by Microsoft. As described by Microsoft, the service provides “interactive visualizations and business intelligence capabilities with an interface simple enough for end users to create their own reports and dashboards.”
The Department of Water Resources is making increasing use of Power BI. Its most recent application can be found on the Department’s Underground Water Storage, Savings and Replenishment webpage (click on “read more” ), where an interactive Power BI program is used to illustrate how Arizona accumulated 11 million acre-feet of long-term underground water-storage credits, as of 2016.
This straightforward, click-able tool for analyzing underground storage over the years actually represents 12 years of effort.


